ELK Stack with FileBeat
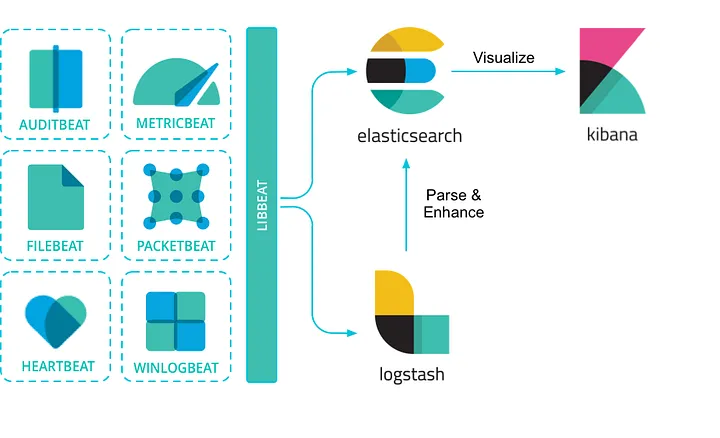
The ELK Stack (Elasticsearch, Logstash, and Kibana) is the world’s most popular open-source log analysis platform. ELK is quickly overtaking existing proprietary solutions and becoming companies’ top choice for log analysis and management solutions. There is one more component — Beats — which collects the data and sends it to Logstash. This led Elastic to rename ELK as the Elastic Stack.
Elasticsearch
Elasticsearch is a NoSQL database. It is based on Lucene search engine, and it is built with RESTful APIS. Elasticsearch offers simple deployment, maximum reliability, and easy management. It also offers advanced queries to perform detail analysis and stores all the data centrally. It is helpful for executing a quick search of the documents. Elasticsearch also allows you to store, search and analyze big volume of data. Modern web and mobile applications have adopted it in search engine platforms.
Why use Elasticsearch?
-
Search: The main advantage of using Elasticsearch is it’s rapid and accurate search functionality. For large datasets, relational databases takes a lot more time for search queries because of the number of joins the query has to go through.
-
Scaling: Distributed architecture of Elasticsearch allows you to scale a lot of servers and data. We can scale the clusters to hundreds of nodes and also we can replicate data to prevent data loss in case of a node failure.
-
Analytical engine: Elasticsearch analytical use case has become more popular than the search use case. Elasticsearch is specifically used for log analysis
Logstash
Logstash is a open-source powerful tool for obtaining, filtering, and normalizing log files. A wide range of plugins for input, output and filtering specifications gives the user a great opportunity to easily configure Logstash to collect, process and channel logs data in many different architectures.
Working with log files is divided into one or more pipelines. In each configured pipeline, one or more input plugins retrieve or gather data that is then placed on an internal queue. Process handling threads read queued data in small data series and process these batches via specified filter plugins in sequence.

After finishing data processing, threads send the data to the related output plugins which in turn are responsible for formatting and sending data to Elasticsearch or any other corresponding engine.
FileBeat
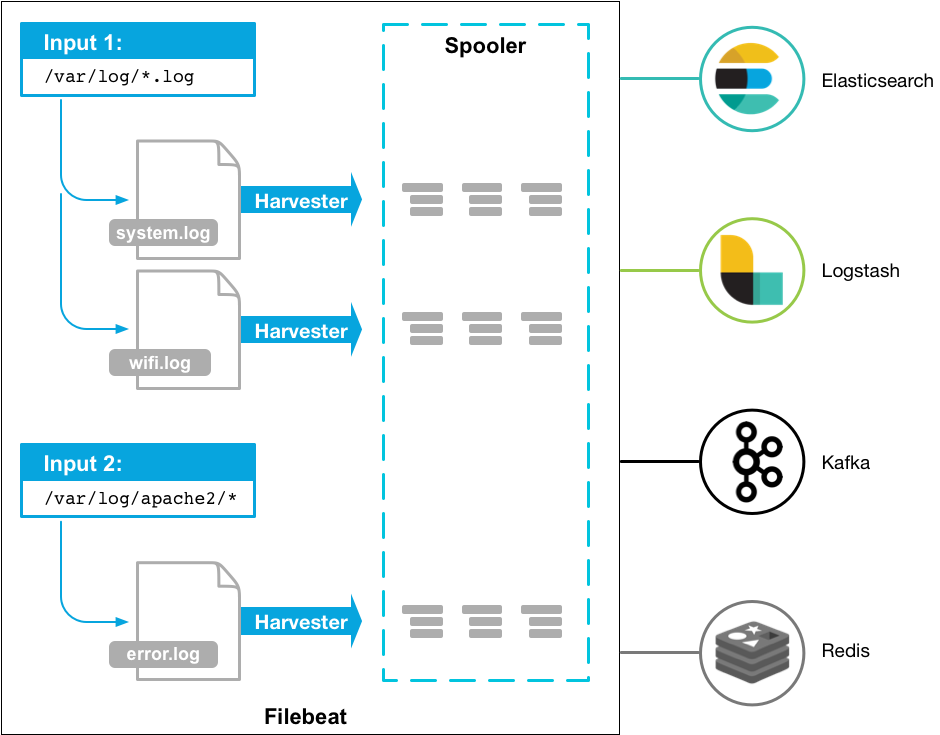
Filebeat is a lightweight shipper for forwarding and centralizing log data. Installed as an agent on your servers, Filebeat monitors the log files or locations that you specify, collects log events, and forwards them either to Elasticsearch or Logstash for indexing.
How Filebeat works: When you start Filebeat, it starts one or more inputs that look in the locations you’ve specified for log data. For each log that Filebeat locates, Filebeat starts a harvester. Each harvester reads a single log for new content and sends the new log data to libbeat, which aggregates the events and sends the aggregated data to the output that you’ve configured for Filebeat.
Kibana
Kibana is a data visualization which completes the ELK stack. This tool is used for visualizing the Elasticsearch documents and helps developers to have a quick insight into it. Kibana dashboard offers various interactive diagrams, geospatial data, and graphs to visualize complex queries.
It is used to search, view, and interact with data stored in Elasticsearch directories and helps you to perform advanced data analysis and visualize your data in a variety of tables, charts, and maps.
Demo
Create AKS Cluster
To create an AKS cluster, use the az aks create command. The following example creates a cluster named myAKSCluster with one node and enables a system-assigned managed identity.
az aks create --resource-group myResourceGroup --name myAKSCluster --enable-managed-identity --node-count 3 -l westus
Connect to the cluster
Configure kubectl to connect to your Kubernetes cluster using the az aks get-credentials command. This command downloads credentials and configures the Kubernetes CLI to use them.
Verify the connection to your cluster using the kubectl get command. This command returns a list of the cluster nodes.
Install ELK stack in AKS cluster using Helm:
- Create namespace with the name of elk.
- List your helm chart and manifest files.
ELK Stack (Elasticsearch, Filebeat, Logstash,Kibana) installation and configuration in AKS cluster with Helm:
- Save your elastic/elasticsearch values and save it as elasticsearch.values file in order to make some configuration.
---
clusterName: "elasticsearch"
nodeGroup: "master"

roles:
  - master
  - data
  - data_content
  - data_hot
  - data_warm
  - data_cold
  - ingest
  - ml
  - remote_cluster_client
  - transform

replicas: 2
minimumMasterNodes: 2
image: "docker.elastic.co/elasticsearch/elasticsearch"
imageTag: "8.5.1"
imagePullPolicy: "IfNotPresent"
resources:
  requests:
    cpu: "1000m"
    memory: "2Gi"
  limits:
    cpu: "1000m"
    memory: "2Gi"
networkHost: "0.0.0.0"
volumeClaimTemplate:
  accessModes: ["ReadWriteOnce"]
  resources:
    requests:
      storage: 30Gi

persistence:
  enabled: true
  labels:
    enabled: false
  annotations: {}

enableServiceLinks: true

protocol: https
httpPort: 9200
transportPort: 9300

service:
  enabled: true
  labels: {}
  labelsHeadless: {}
  type: ClusterIP
  publishNotReadyAddresses: false
  nodePort: ""
  annotations: {}
  httpPortName: http
  transportPortName: transport
  loadBalancerIP: ""
  loadBalancerSourceRanges: []
  externalTrafficPolicy: ""

maxUnavailable: 1
sysctlVmMaxMapCount: 262144

readinessProbe:
  failureThreshold: 3
  initialDelaySeconds: 10
  periodSeconds: 10
  successThreshold: 3
  timeoutSeconds: 5


tests:
  enabled: true
Installation and configuration of Kibana via Helm into AKS Cluster:
- Change the values configuration with LoadBalancer.---
elasticsearchHosts: "https://elasticsearch-master:9200"
replicas: 1
image: "docker.elastic.co/kibana/kibana"
imageTag: "8.5.1"
imagePullPolicy: "IfNotPresent"
resources:
requests:
cpu: "1000m"
memory: "2Gi"
limits:
cpu: "1000m"
memory: "2Gi"
protocol: http
serverHost: "0.0.0.0"
healthCheckPath: "/app/kibana"
automountToken: true
httpPort: 5601
service:
type: LoadBalancer
loadBalancerIP: ""
port: 5601
nodePort: ""
labels: {}
annotations: {}
loadBalancerSourceRanges: []
httpPortName: http
readinessProbe:
failureThreshold: 3
initialDelaySeconds: 10
periodSeconds: 10
successThreshold: 3
timeoutSeconds: 5
Installation and configuration of logstash via Helm into AKS Cluster:
- Installation of logstash via Helm.
- logstash.values ---> !!! update elasticsearch password you can access alestichsearcg password this command:
kubectl get secrets -n elk elasticsearch-master-credentials -ojsonpath='{.data.password}' | base64 --decode
---
replicas: 1

logstashConfig:
  logstash.yml: |
    http.host: 0.0.0.0
    # xpack.monitoring.enabled: false


logstashPipeline:
  logstash.conf: |
    input {
      beats {
        port => 5044
      }
    }
    output {
      elasticsearch {
        hosts => [ "https://elasticsearch-master:9200" ]
        ssl => true
        manage_template => false
        ssl_certificate_verification => true
        index => "logstash-%{+YYYY.MM.dd}"
        document_type => "%{[@metadata][type]}"
        cacert => "/usr/share/logstash/certs/ca.crt"
        user => "${ELASTICSEARCH_USERNAME}"
        password => "${ELASTICSEARCH_PASSWORD}"  #update password
      }
    }


image: "docker.elastic.co/logstash/logstash"
imageTag: "8.5.1"
imagePullPolicy: "IfNotPresent"

extraEnvs:
  - name: "ELASTICSEARCH_USERNAME"
    valueFrom:
      secretKeyRef:
        name: elasticsearch-master-credentials
        key: username
  - name: "ELASTICSEARCH_PASSWORD"
    valueFrom:
      secretKeyRef:
        name: elasticsearch-master-credentials
        key: password


secretMounts:
  - name: elasticsearch-master-certs
    secretName: elasticsearch-master-certs
    path: /usr/share/logstash/certs/


logstashJavaOpts: "-Xmx1g -Xms1g"

resources:
  requests:
    cpu: "100m"
    memory: "1536Mi"
  limits:
    cpu: "1000m"
    memory: "1536Mi"

volumeClaimTemplate:
  accessModes: ["ReadWriteOnce"]
  resources:
    requests:
      storage: 1Gi


httpPort: 9600

maxUnavailable: 1

livenessProbe:
  httpGet:
    path: /
    port: http
  initialDelaySeconds: 300
  periodSeconds: 10
  timeoutSeconds: 5
  failureThreshold: 3
  successThreshold: 1

readinessProbe:
  httpGet:
    path: /
    port: http
  initialDelaySeconds: 60
  periodSeconds: 10
  timeoutSeconds: 5
  failureThreshold: 3
  successThreshold: 3

service:
  annotations: {}
  type: ClusterIP
  loadBalancerIP: ""
  ports:
    - name: beats
      port: 5044
      protocol: TCP
      targetPort: 5044
    - name: http
      port: 8080
      protocol: TCP
      targetPort: 8080
Installation and configuration of Filebeat via Helm into AKS Cluster:
- Installation of Filebeat via Helm.
- filebeat.values
---
daemonset:
  enabled: true
  extraEnvs:
    - name: "ELASTICSEARCH_USERNAME"
      valueFrom:
        secretKeyRef:
          name: elasticsearch-master-credentials
          key: username
    - name: "ELASTICSEARCH_PASSWORD"
      valueFrom:
        secretKeyRef:
          name: elasticsearch-master-credentials
          key: password

  filebeatConfig:
    filebeat.yml: |
      filebeat.inputs:
      - type: container
        paths:
          - /var/log/containers/*.log
        processors:
        - add_kubernetes_metadata:
            host: ${NODE_NAME}
            matchers:
            - logs_path:
                logs_path: "/var/log/containers/"

      output.logstash:
        hosts: ["logstash-logstash:5044"]

  maxUnavailable: 1

  secretMounts:
    - name: elasticsearch-master-certs
      secretName: elasticsearch-master-certs
      path: /usr/share/filebeat/certs/


deployment:

  enabled: false
  extraEnvs:
    - name: "ELASTICSEARCH_USERNAME"
      valueFrom:
        secretKeyRef:
          name: elasticsearch-master-credentials
          key: username
    - name: "ELASTICSEARCH_PASSWORD"
      valueFrom:
        secretKeyRef:
          name: elasticsearch-master-credentials
          key: password

  filebeatConfig:
    filebeat.yml: |
      filebeat.inputs:
        - type: log
          paths:
            - /usr/share/filebeat/logs/filebeat

      output.elasticsearch:
        host: "${NODE_NAME}"
        hosts: '["https://${ELASTICSEARCH_HOSTS:elasticsearch-master:9200}"]'
        username: "${ELASTICSEARCH_USERNAME}"
        password: "${ELASTICSEARCH_PASSWORD}"
        protocol: https
        ssl.certificate_authorities: ["/usr/share/filebeat/certs/ca.crt"]


  secretMounts:
    - name: elasticsearch-master-certs
      secretName: elasticsearch-master-certs
      path: /usr/share/filebeat/certs/

  securityContext:
    runAsUser: 0
    privileged: false
  resources:
    requests:
      cpu: "100m"
      memory: "100Mi"
    limits:
      cpu: "1000m"
      memory: "200Mi"

replicas: 1

hostPathRoot: /var/lib

image: "docker.elastic.co/beats/filebeat"
imageTag: "8.5.1"
imagePullPolicy: "IfNotPresent"
imagePullSecrets: []

livenessProbe:
  exec:
    command:
      - sh
      - -c
      - |
        #!/usr/bin/env bash -e
        curl --fail 127.0.0.1:5066
  failureThreshold: 3
  initialDelaySeconds: 10
  periodSeconds: 10
  timeoutSeconds: 5

readinessProbe:
  exec:
    command:
      - sh
      - -c
      - |
        #!/usr/bin/env bash -e
        filebeat test output
  failureThreshold: 3
  initialDelaySeconds: 10
  periodSeconds: 10
  timeoutSeconds: 5

managedServiceAccount: true

clusterRoleRules:
  - apiGroups:
      - ""
    resources:
      - namespaces
      - nodes
      - pods
    verbs:
      - get
      - list
      - watch
  - apiGroups:
      - "apps"
    resources:
      - replicasets
    verbs:
      - get
      - list
      - watch
Deployment of sample applications into AKS kubernetes environment:
apiVersion: v1
kind: PersistentVolume
metadata:
  name: db-pv-vol
  labels:
    type: local
spec:
  storageClassName: manual
  capacity:
    storage: 5Gi
  accessModes:
    - ReadWriteOnce
  hostPath:
    path: "/home/ubuntu/pv-data"
---
apiVersion: v1
kind: PersistentVolumeClaim
metadata:
  name: database-persistent-volume-claim
spec:
  accessModes:
    - ReadWriteOnce
  storageClassName: manual
  resources:
    requests:
      storage: 1Gi
---
apiVersion: apps/v1
kind: Deployment
metadata:
  name: db-deployment
spec:
  replicas: 1
  selector:
    matchLabels:
      name: mongo
  template:
    metadata:
      labels:
        name: mongo
        app: todoapp
    spec:
      containers:
      - image: mongo:5.0
        name: mongo
        ports:
        - containerPort: 27017
        volumeMounts:
          - name: mongo-storage
            mountPath: /data/db
      volumes:
        #- name: mongo-storage
        #  hostPath:
        #    path: /home/ubuntu/pv-data
        - name: mongo-storage
          persistentVolumeClaim:
            claimName: database-persistent-volume-claim
---
apiVersion: v1
kind: Service
metadata:
  name: db-service
  labels:
    name: mongo
    app: todoapp
spec:
  selector:
    name: mongo
  type: ClusterIP
  ports:
    - name: db
      port: 27017
      targetPort: 27017
---
apiVersion: apps/v1
kind: Deployment
metadata:
  name: web-deployment
spec:
  replicas: 1
  selector:
    matchLabels:
      name: web
  template:
    metadata:
      labels:
        name: web
        app: todoapp
    spec:
      containers:
        - image: ersinsari/todo
          imagePullPolicy: Always
          name: myweb
          ports:
            - containerPort: 3000
          env:
            - name: "DBHOST"
              value: db-service
          resources:
            limits:
              memory: 500Mi
              cpu: 100m
            requests:
              memory: 250Mi
              cpu: 80m
---
apiVersion: v1
kind: Service
metadata:
  name: web-service
  labels:
    name: web
    app: todoapp
spec:
  selector:
    name: web
  type: LoadBalancer
  ports:
   - name: http
     port: 3000
     targetPort: 3000
     protocol: TCP
Part-5 Kibana Dashboard configuration and sample app log monitoring:
Dashboard configuration and index pattern creation:
- Go to http://loadbalancer-ip:5601
username: elastic password: $(kubectl get secrets -n elk elasticsearch-master-credentials -ojsonpath='{.data.password}' | base64 --decode)
-
Discover: create an index pattern
-
logstash-*
-
select @timestamp
-
create an index pattern.
-
filter your data using KQL syntax : kubernetes.deployment.name web-deployment
- You can explore logs info